
Reporting
As a Victories administrator, you have a suite of reporting tools at your fingertips to help you track, adjust, and grow your program. This section will show you how to use the Reporting tools. Dashboards and Data Export help you create reports for your organization’s unique culture and needs, while Manage Access allows you to control who in your organization can access recognition activity data. Both are located under Toolbox > Admin Home > Reporting.
Dashboards
- Live Stats
- Flight Risk
- Activity
- Order Activity
- Exceptions
- Points Summary
- Mobile Activity
- Trending
- Billing
- Impact
- Pulse Survey: User Experience Satisfaction
- Pulse Survey: Culture and Business Impact
Data Export
Manage Access
Pro Tips
Dashboards
Get an interactive snapshot of your program activity through a variety of lenses. Depending on your program and access, there are as many as 12 admin dashboards you can use to examine different aspects of your program.
Live Stats
The Live Stats Dashboard allows you to see real time program activity in a visualization or spreadsheet form. View activity for eCards, nominations, approvals, orders, and more.
Summary of Activity
Displays an overview of the various activity types and gives a count of the total numbers of activity within the time frame. All activity columns will appear regardless of whether it applies to your program or not.
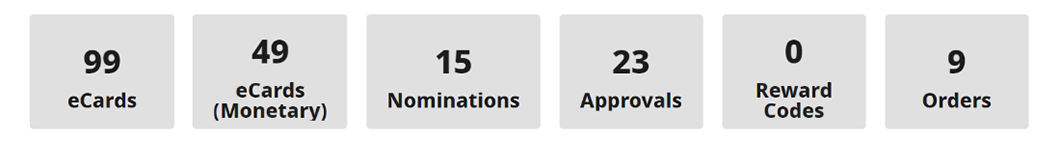
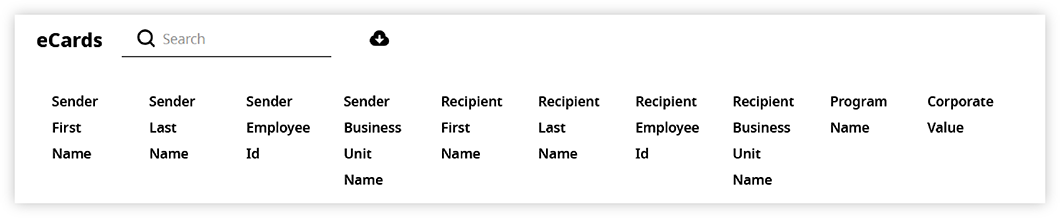
Activity Details
Click on each individual number to get a list of all activities in that category for the full time window. The list can be downloaded by clicking the download icon at the top of the details page.
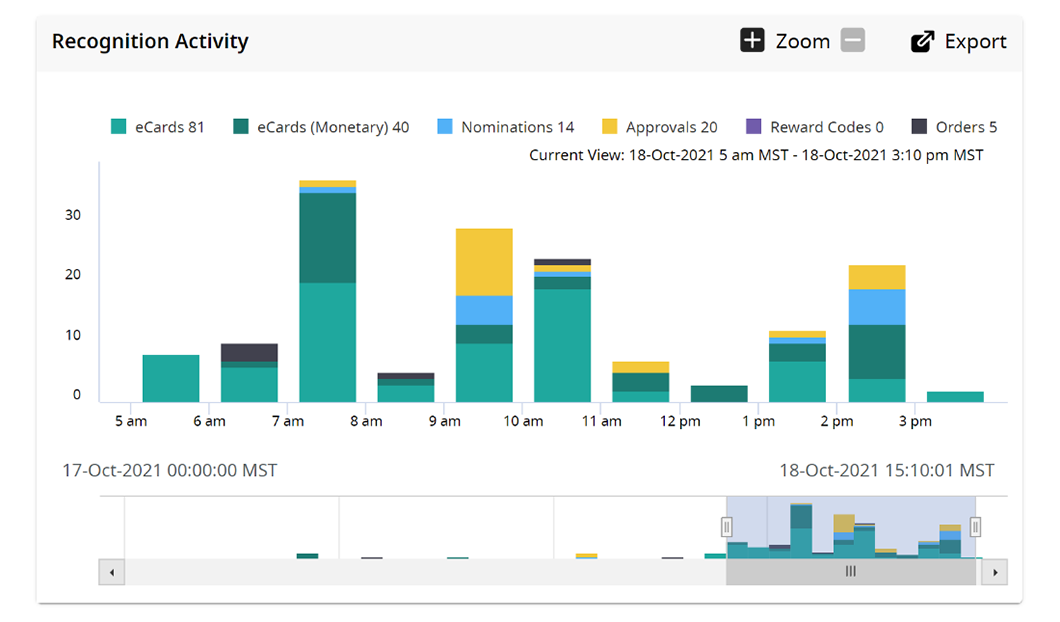
Recognition Activity
See recognition activity within the time frame. Zoom in or out on the graph, export it as a .jpg or .png, or view details in specific hour time blocks by hovering over bars on the graph.
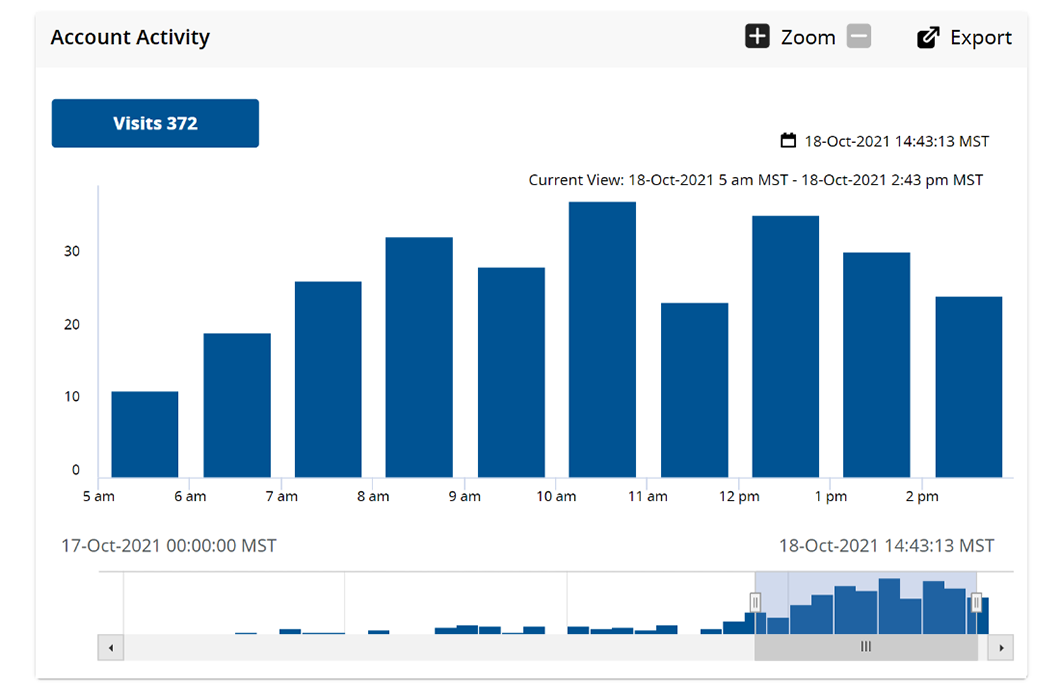
Account Activity
View account activity (i.e. overall visits) within the time frame.
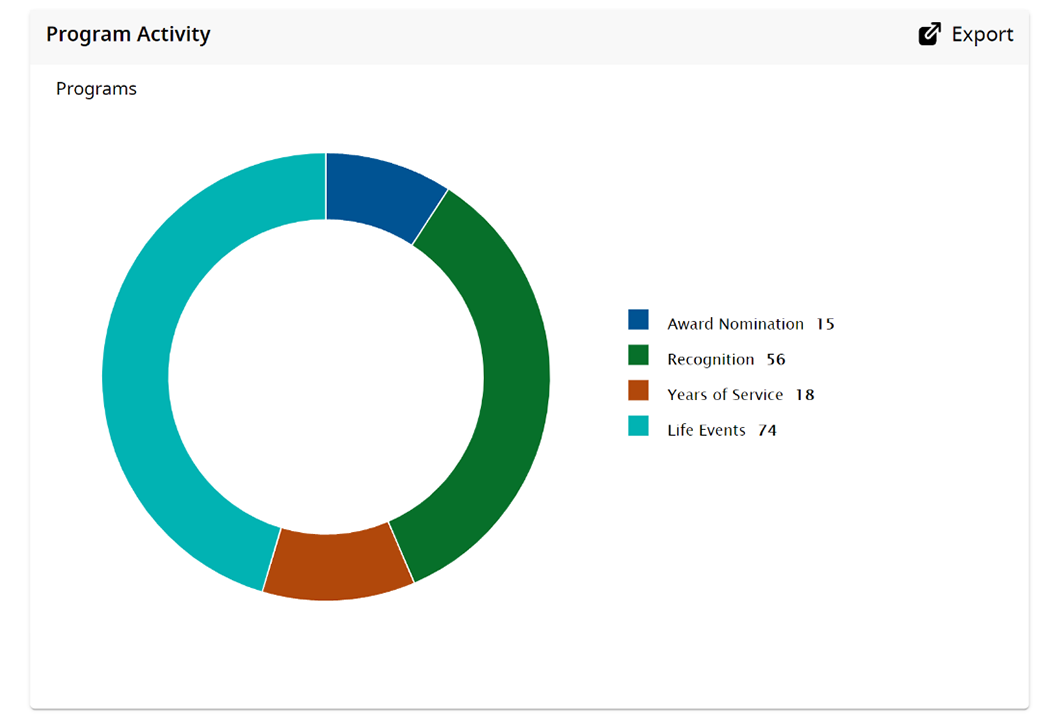
Program Activity
View program activity within the rolling time frame. First click displays the types of recognition activities, while the second click displays award levels issued.
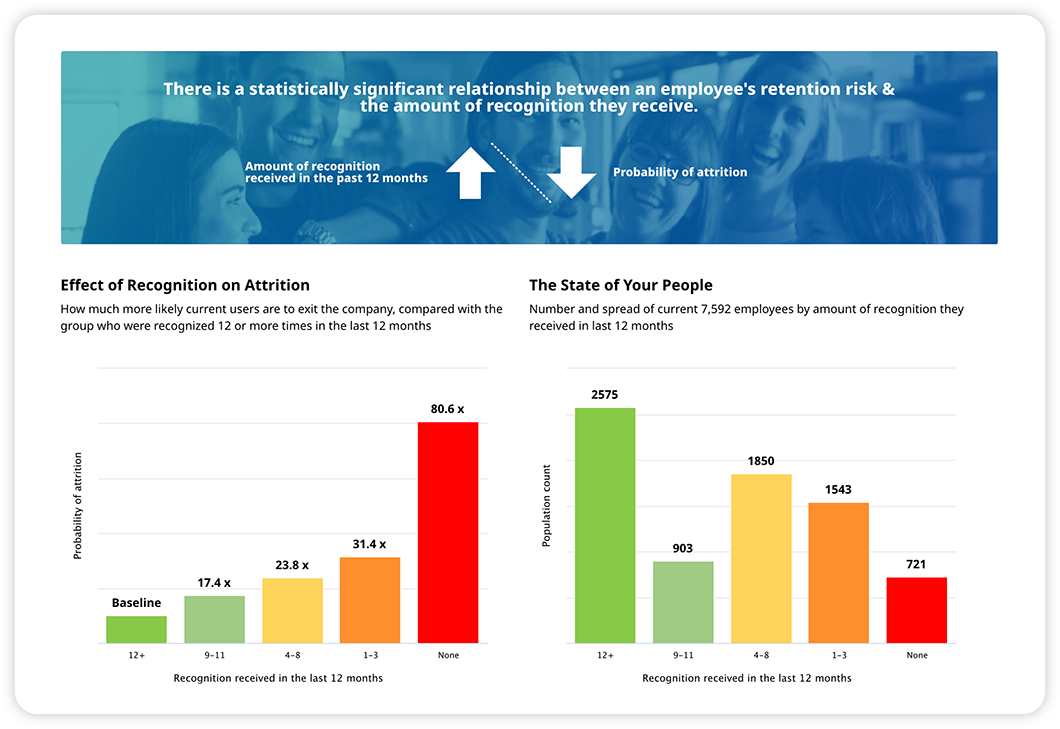
Flight Risk
The Flight Risk Dashboard helps program admins and sponsors understand the relationship between recognition and attrition. This new dashboard shows the number of employees at risk of leaving your organization, demonstrated by the relationship with the amount of recognition they receive.
Activity
The Activity Dashboard combines details of all the recognition given and received in your program into a single report. More specifically, it provides summary data related to recognition events in your program for all activities combined by volume, current state, or over time.

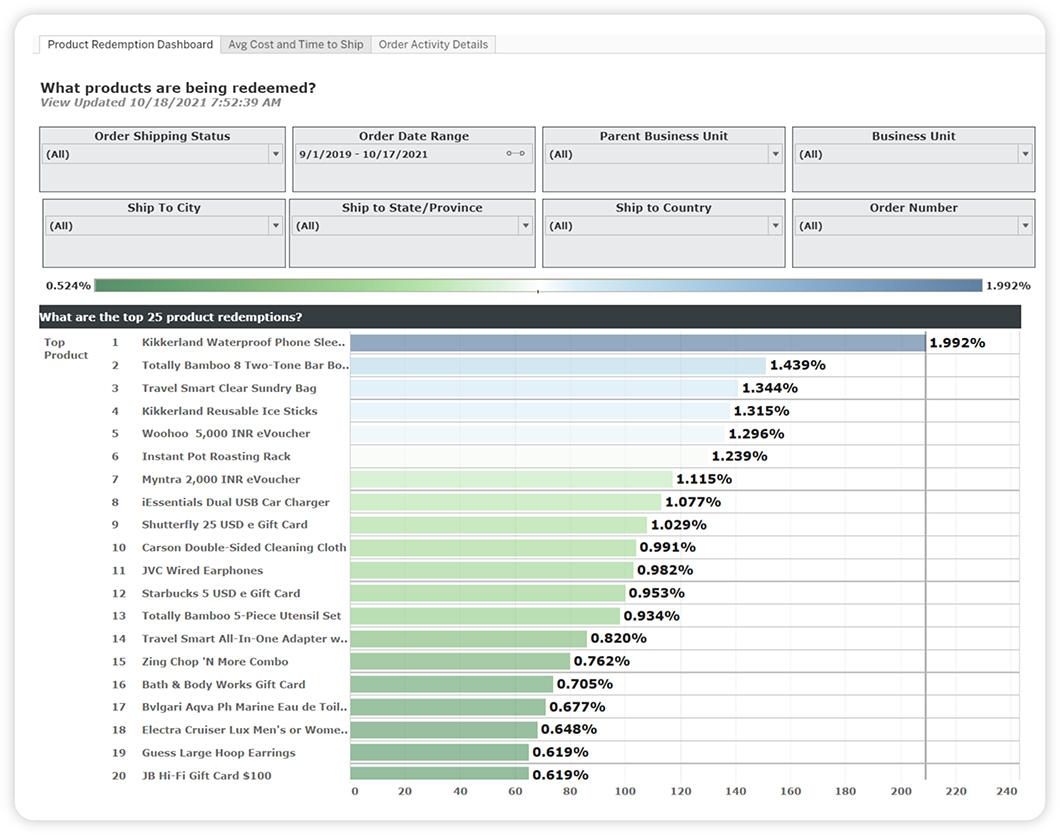
Order Activity
The Order Activity Dashboard gives you access to details related to redemption activity including information such as the awards that are being ordered, how quickly they are delivered, and award tracking information.
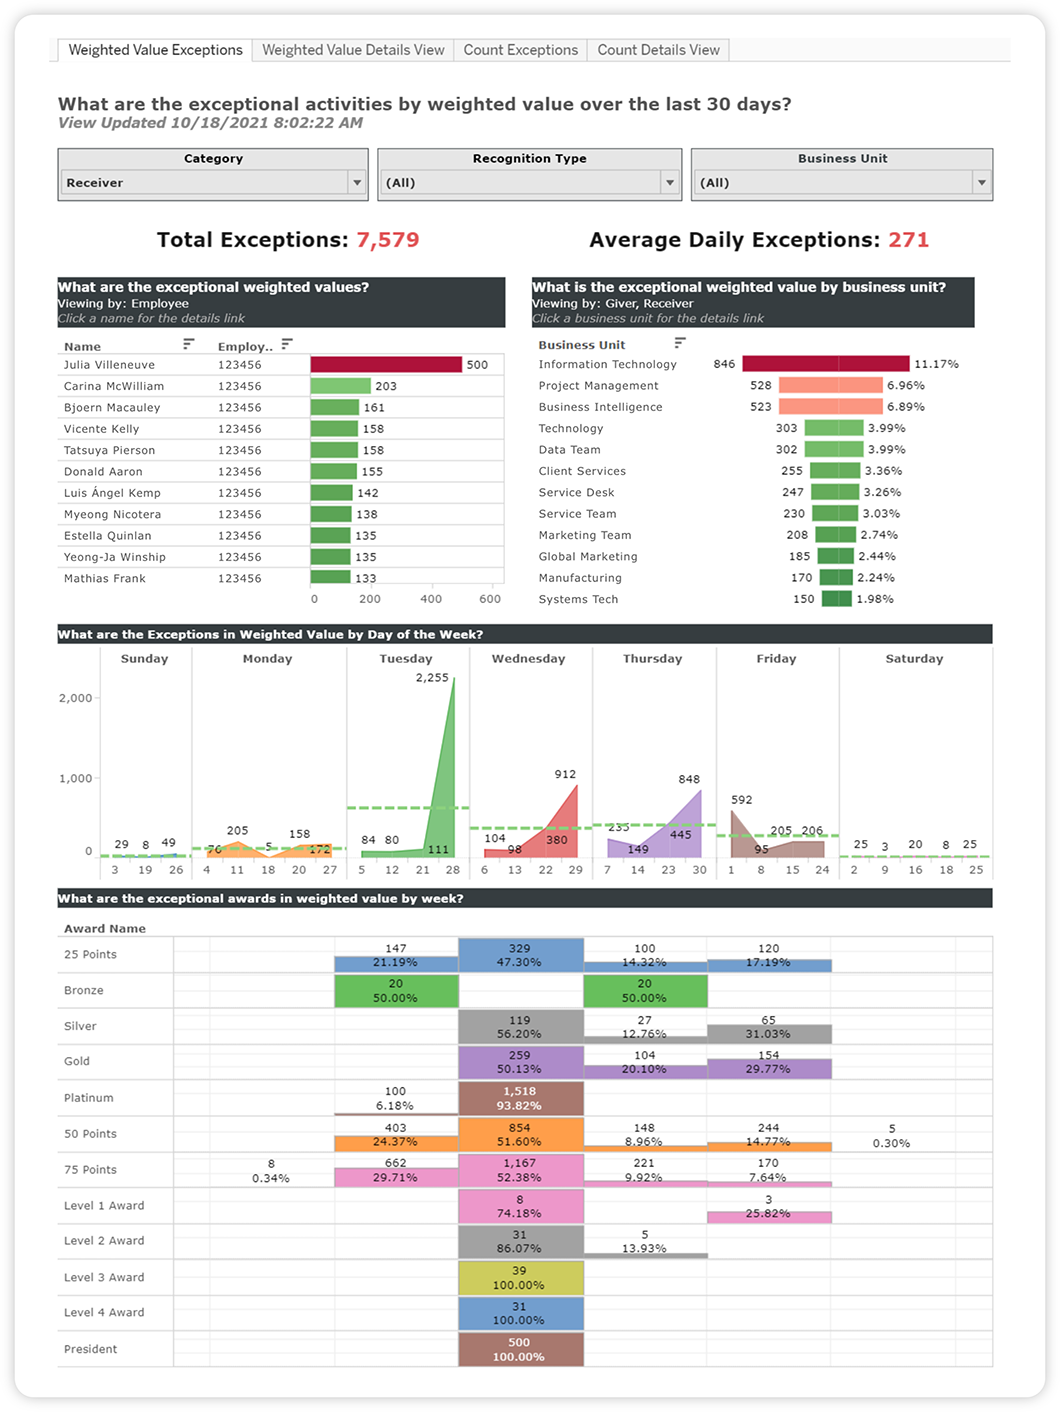
Exceptions
The Exceptions Dashboard allows you to easily identify questionable recognition activity that is outside of the normal give and receive trends. Of course, not all activity outside of the norm is fraudulent, but if there is any fraudulent activity happening, you’ll find it here.
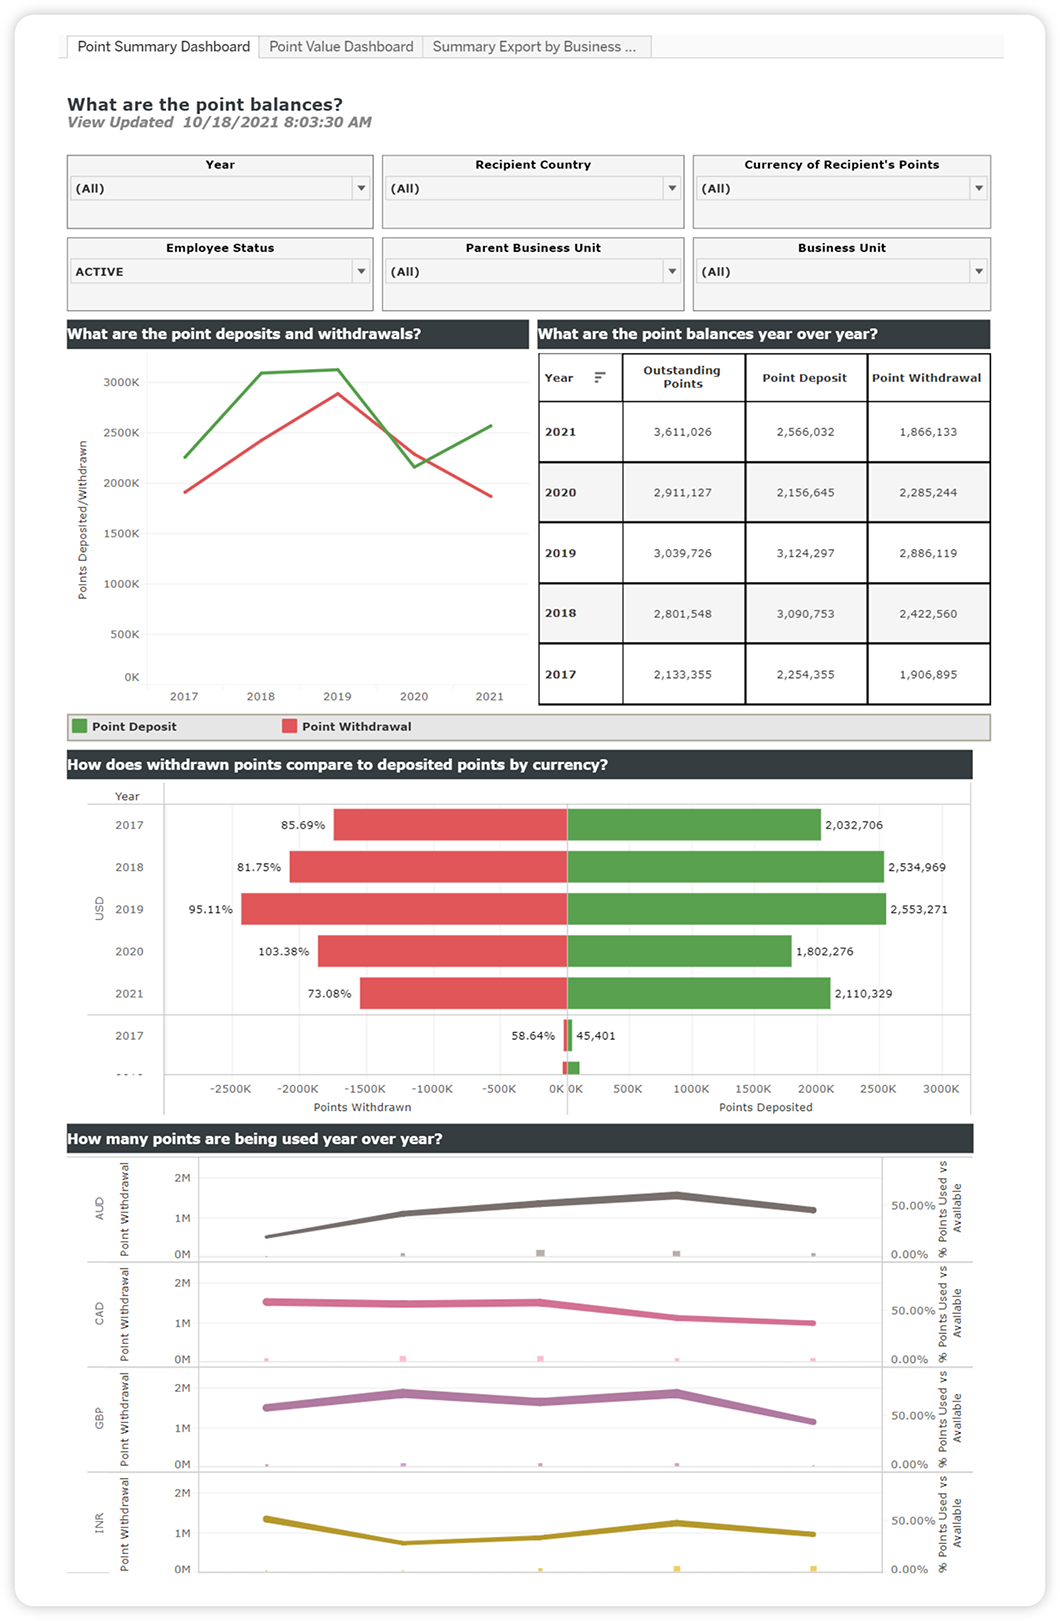
Points Summary
The Points Summary Dashboard shows how points are accumulating over time at the program and individual level, helping you determine if adjustments need to be made.
Mobile Activity
The Mobile Activity Dashboard provides insight into usage and adoption of mobile usage for your program, showing the number of mobile actions users have registered.

Trending
The Trending Dashboard shows recognition trends (sending eCards, nominations, or other types of awards) to give you an accurate representation of how effectively people are using your recognition platform.

Billing
The Billing Dashboard is a SOC II compliant method for reconciling and tracking invoicing on a recognition program. It contains invoice numbers, user information, item information, and the financial breakdowns associated.

Impact
The Impact Dashboard shows who is participating in giving and receiving recognition across the organization currently, as well as trends over time.

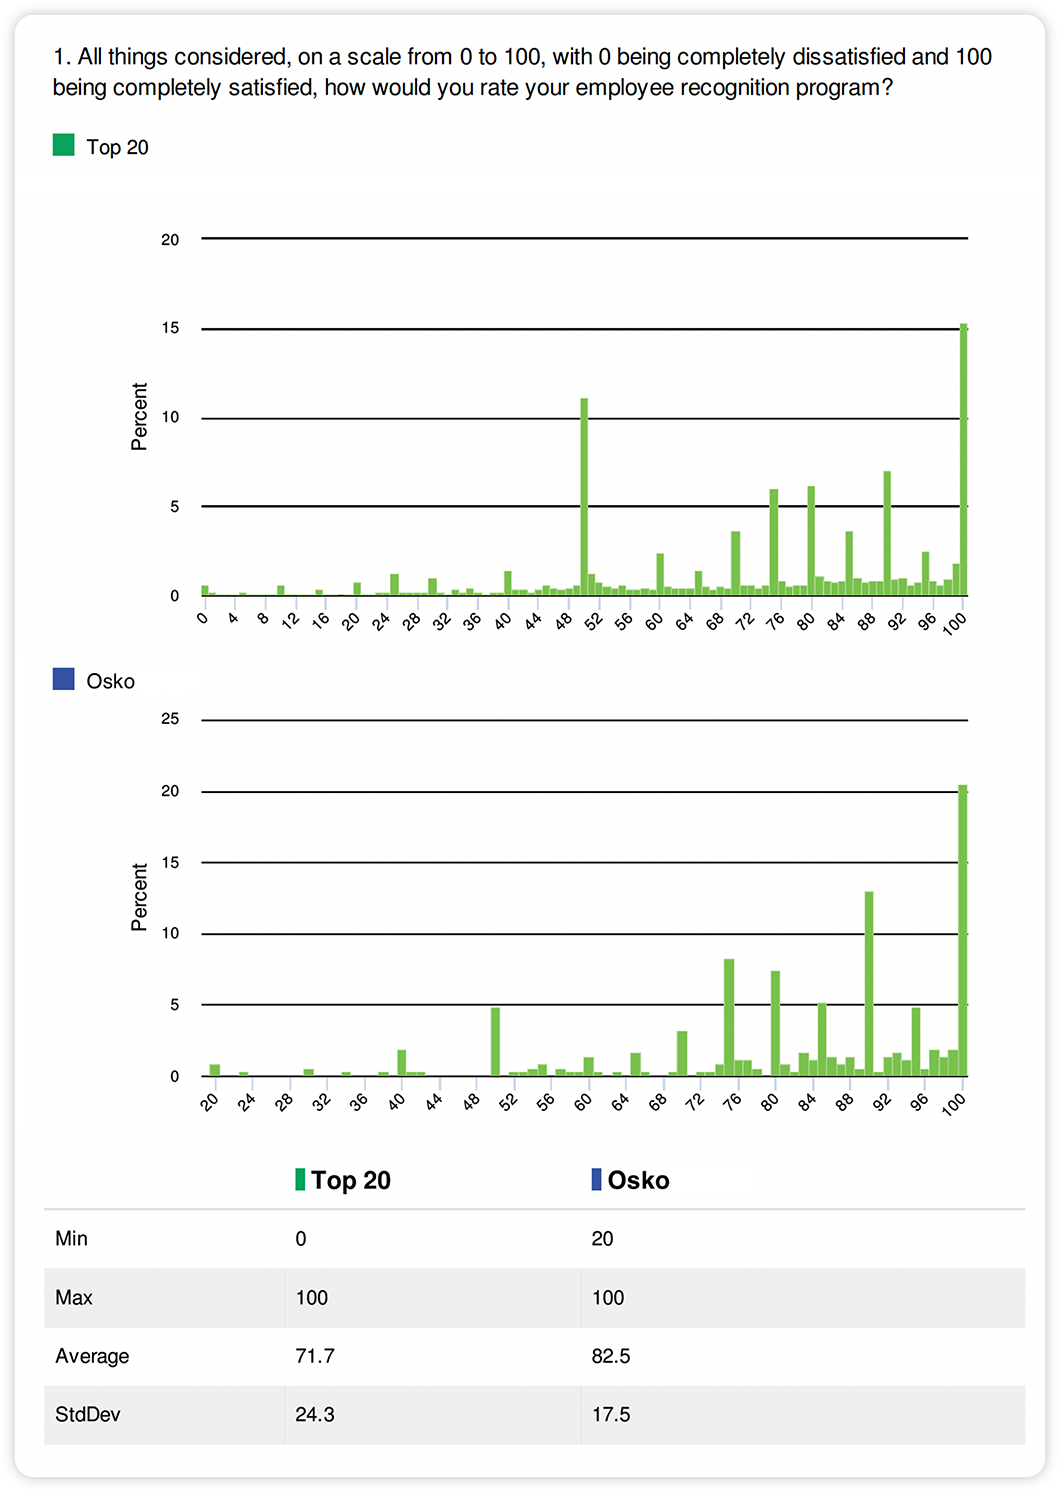
Pulse Survey: User Experience Satisfaction
The User Experience Satisfaction Dashboard uses a pulse survey to gain insight into program metrics like employee satisfaction, observed recognition, and program familiarity. It also compares results with our top 20 clients to help determine benchmarks.
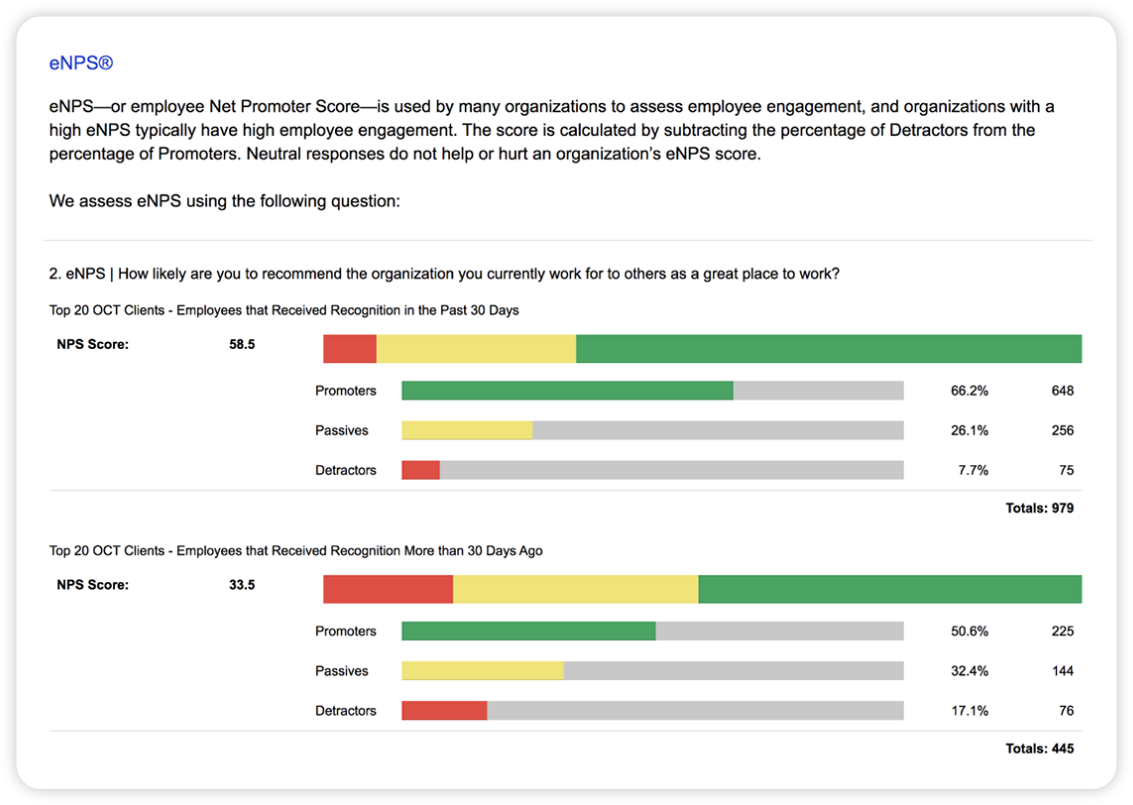
Pulse Survey: Culture and Business Impact
The Culture and Business Impact Dashboard uses a pulse survey to reveal cultural sentiment, Net Promoter Scores, and intention-to-leave differences between employees who have received recognition in the last 30 days and those that haven’t.
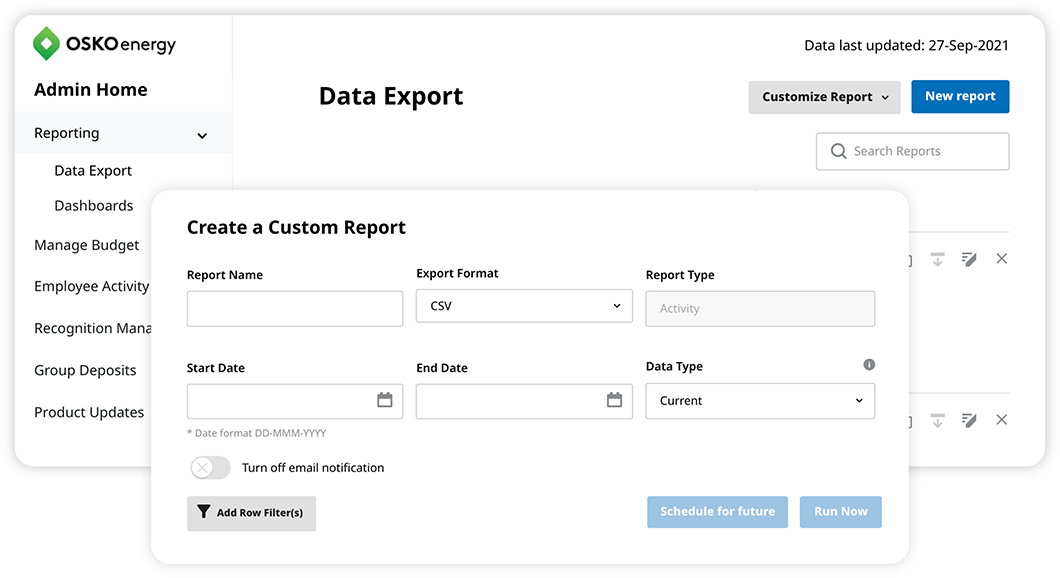
Data Export
Create detailed reports that provide a deeper look into the users and groups performing recognition activity, as well as budget and accounting information.
Activity Report
Includes data from all activity on your program including eCards, Nominations, Reward Codes, and Point Deposits. It is meant primarily for detailed activity being given and received in a program.
Billing Detail
Shows billing details for each consolidated month. This report is similar to the Billing Dashboard, but is more flexible as several fields are able to be filtered.
Budget
Includes data from all monetary recognition that hits the budget from eCards, Nominations, or Reward Codes. A great method for seeing how individual recognition is affecting the budget tool, and what the impact might be.
Employee Visits
Shows data for every time a user has logged into your recognition site during the selected time frame. This report allows you to see who has not visited the recognition program site during a specified time range, so you can follow up with non-users to encourage participation.
Orders Report
Includes data from all orders that have been placed, shipped, or invoiced, though the data included begins from the time of order and may not necessarily be finalized. This data might be used for checking cancelled orders, credits, or items that have not yet shipped. The orders report pulls data based on the date that the order was entered into the system.
Payroll Issued Report
A report that includes data from all issued monetary recognition. It is at the point of issuance. The financial information around the value of the award is estimated as it is not yet invoiced or final. Primarily used as a taxation report for clients who tax at the time of issuance. The payroll issued report pulls data based on the date that it was issued to the employee's account.
Payroll Redeemed Report
A report that includes data from all orders that have been placed, shipped, and invoiced. Orders in this report have been invoiced and finalized. The financial data is final and is intended for taxation purposes. Primarily used as a taxation report for clients who tax at the time of redemption.
Points Summary Report
A report that includes data showing all individuals points on the program. It breaks it down to give visibility into what was issued, redeemed, adjusted, and unused for each individual during a time frame. It can be used as a method to show outstanding points, redemption practices, as well as who is receiving the most points. The Points Summary report reflects all point activity within the selected date range.
Manage Access
The Manage Access tool allows you to assign specific users access to different segments of recognition activity data, and to limit access by business unit, country, or individual program.
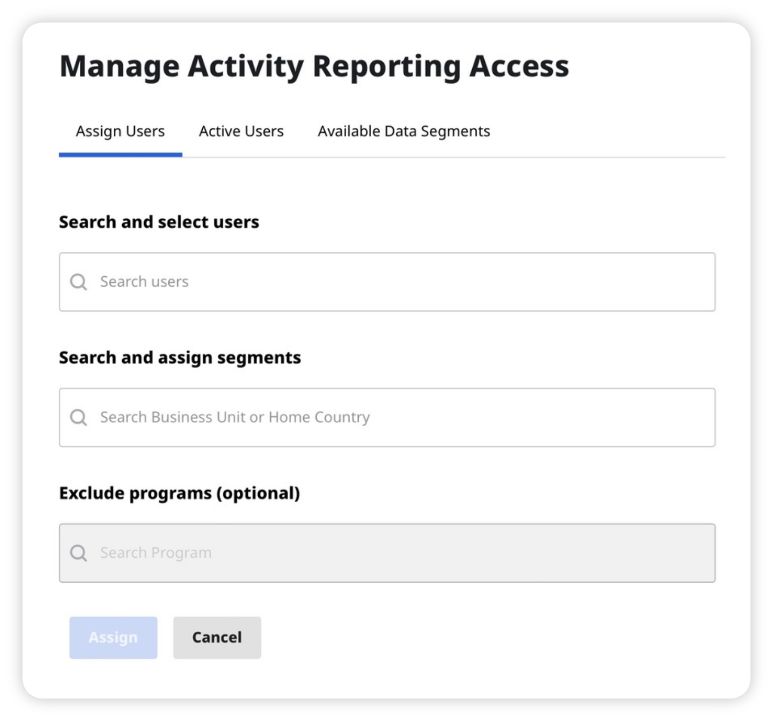
Assign Users
Search and select users and assign access to specific recognition program data. Choose the Business Unit(s) or Home Country(ies) you wish to assign. You can exclude data from programs within the assigned business unit(s) or country(ies), if it is not appropriate for those assigned to have access to certain information.
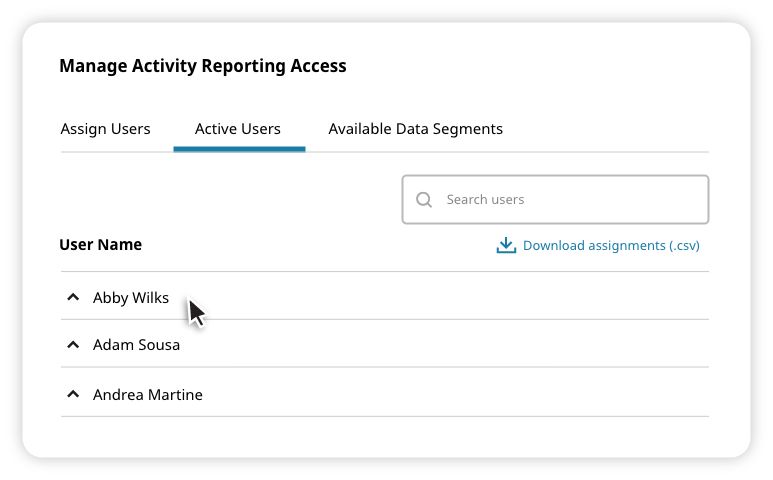
Active Users
Easily view and download a report of all Activity Reporting assignments.
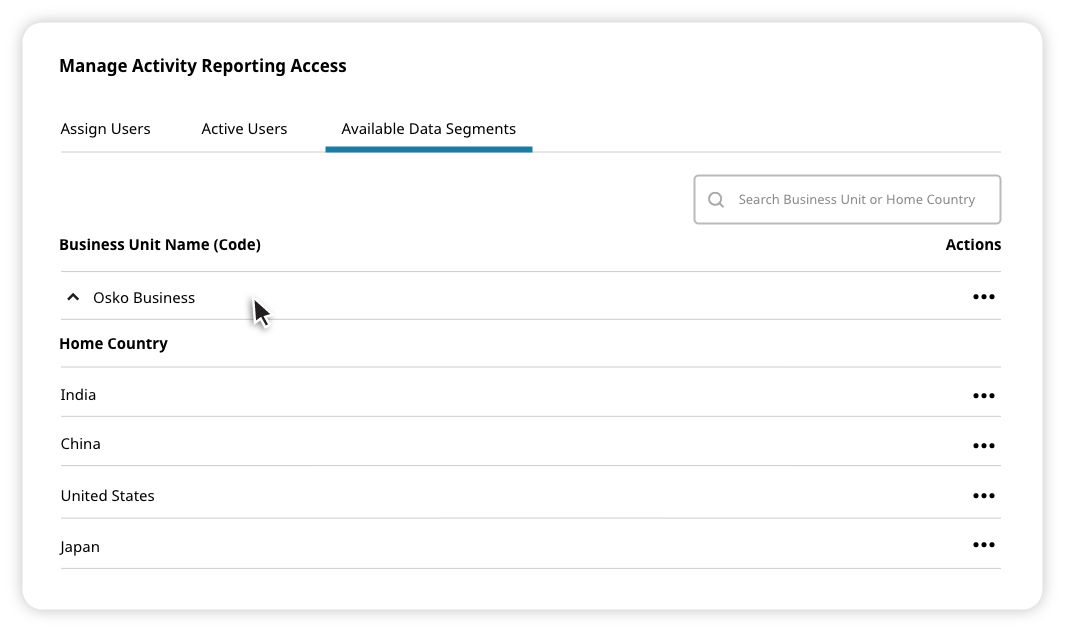
Available Data Segments
View and make Activity Reporting assignments by Business Unit or Home Country.
Pro Tips
Report delivery
All reports are delivered based in Mountain Time and show data from a rolling 48 hour time period. Meaning that wherever you are in the world, you can view data from the current day and the previous day (in MT). Payroll redeemed and billing reports are available starting the second day of the month following the one you want to view.
Activity
All activity reports pull data based on the submitted date of the activity. Most refresh at night (MT), except the Live Stats Dashboard, which refreshes every few minutes. To find out when the last update happened, visit the Data Export homepage.
Adjusting date ranges
You can adjust the date range of a report in Tableau by moving the slider in the Submitted Date field or clicking the date and typing the range in manually.
Customizing output
1. Click Create New Report

2. Select Report Type: choose the type of report you want or create a custom report.
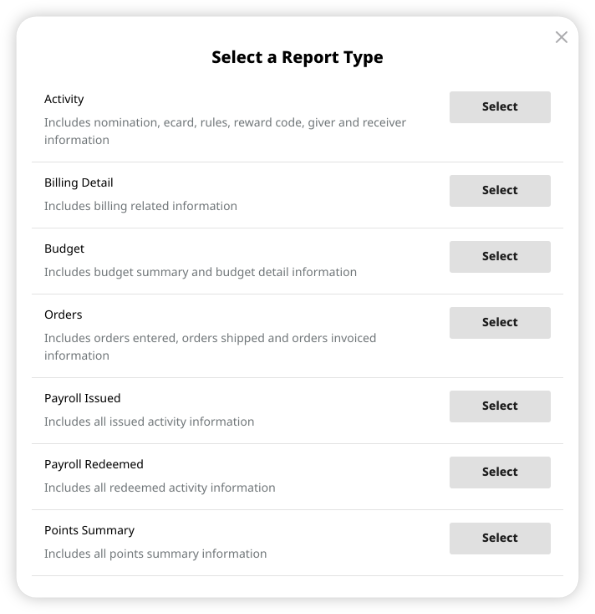
3. Fill out report fields.
4. Select report fields (All report fields are selected by default, but can be turned off individually.)
5. Confirm column order.
6. Run now or schedule to run in the future.

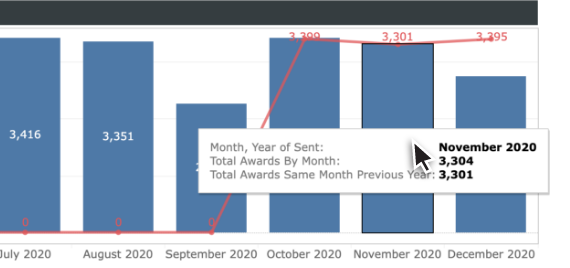
See more details
To see the details for specific time periods, hover your cursor over it. You can also zoom in or out of each graph, as well as export it as a .jpg or .png.
Downloading sections
To download sections of a report as an Excel file, click the Download button at the bottom of the report screen and select Crosstab.

Permissions
Only administrator users with appropriate permissions are able to access Victories admin tools. Please contact your Client Success Specialist if you need access to these links, but are unable to see them on your Admin Home page.
Supported browsers
Victories supports Internet Explorer 11 (and newer) and the current and previous versions of Firefox, Chrome, and Safari.
For the quickest response please complete the form below.
1930 South State Street
Salt Lake City, UT 84115
United States of America
4200 Fairview Street
Burlington, Ontario L7L 4Y8
Canada
1 Langston Road
Loughton, Essex IG10 3SD
United Kingdom
Level 7, Tower II, Phase II
Raiaskaran TechPark
Andheri Kurla Road
Andheri East
Mumbai 400072
India
Level 15, 350 Queen Street
Melbourne VIC 3000
Australia
300 Beach Road, #34-07
The Concourse
Singapore 199555